
Click Me To Visit The Project GitHub Repo
Problem Statement
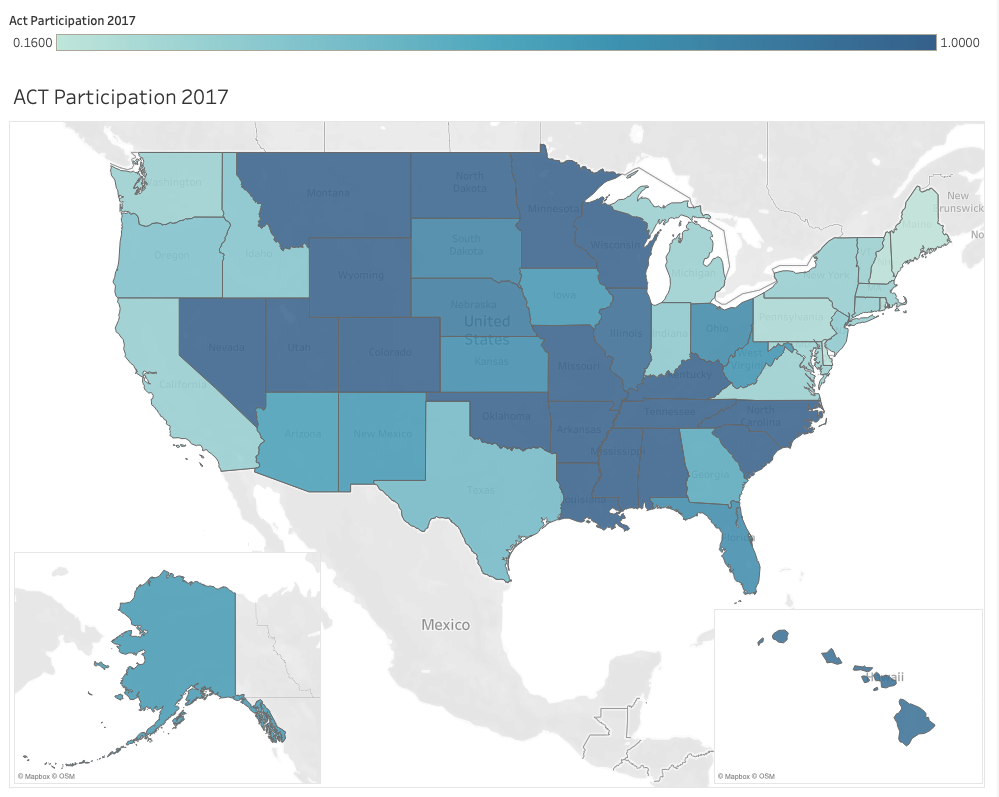
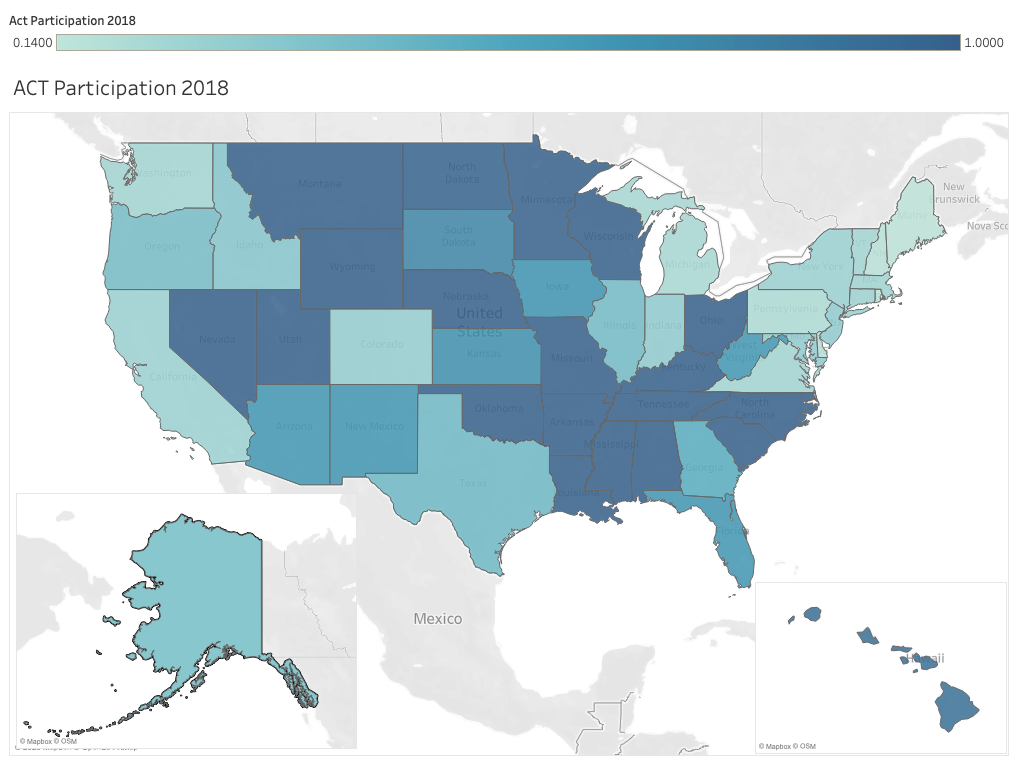
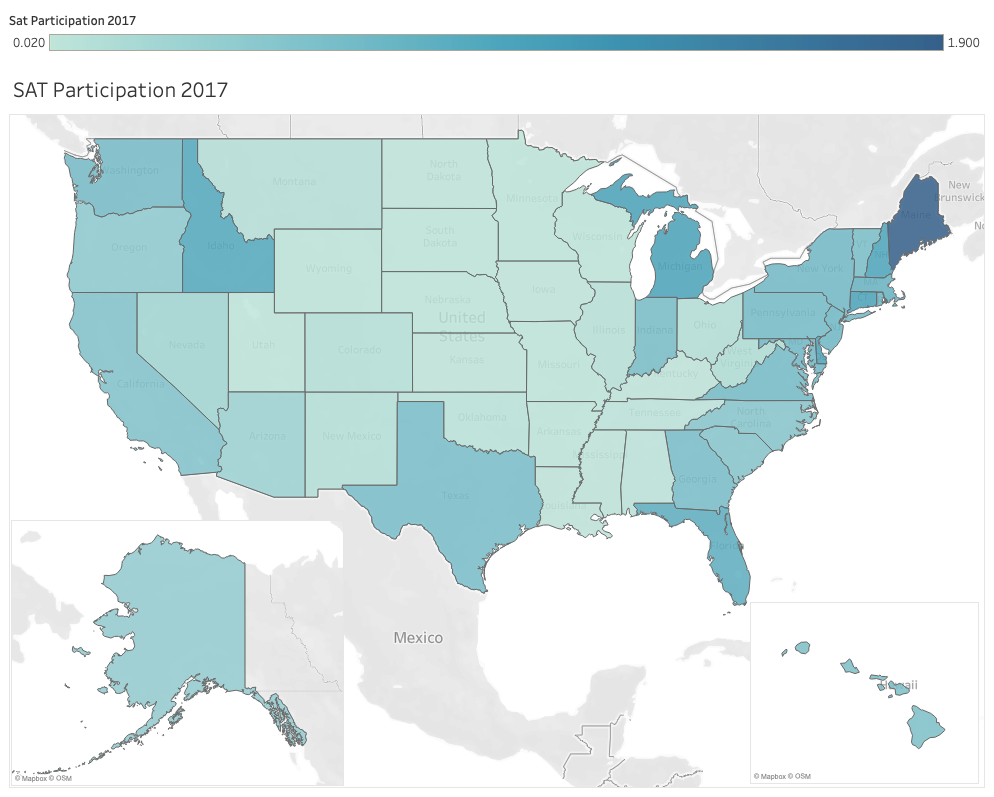
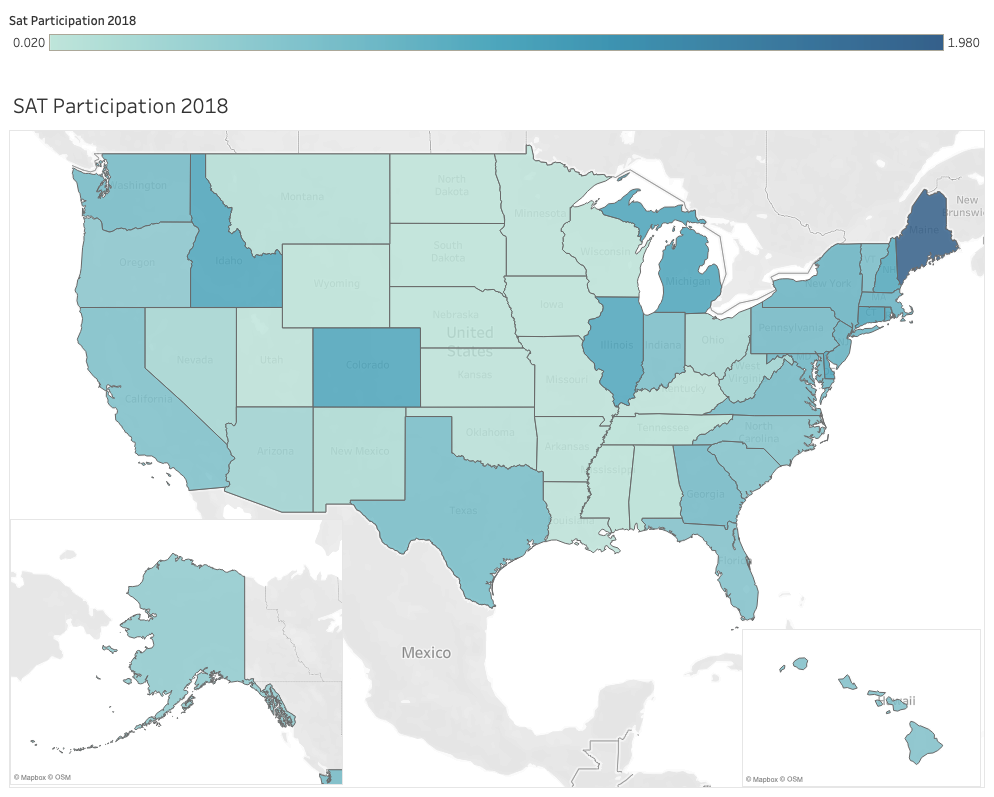
Participation rate changes have been recorded for both the SAT and ACT exams between 2017 and 2018. This report explores the reasons for the these changes within the United States categorized by test and subject.
Executive Summary
2017 Data Import & Cleaning
Errors such as extra characters were corrected and percentages were removed to convert all numerical data in numbers with decimal points.
2018 Data Import and Cleaning
Data was found to match the data fields of 2017’s data. The cleaned-up data from both 2017 and 2018 were combined to a single data frame for the ease of comparison.
Exploratory Data Analysis
The standard deviation for each numerical variable were calculated using three different methods. The highest and lowest states were identified in terms of participation rates and scores.
Data Visualization
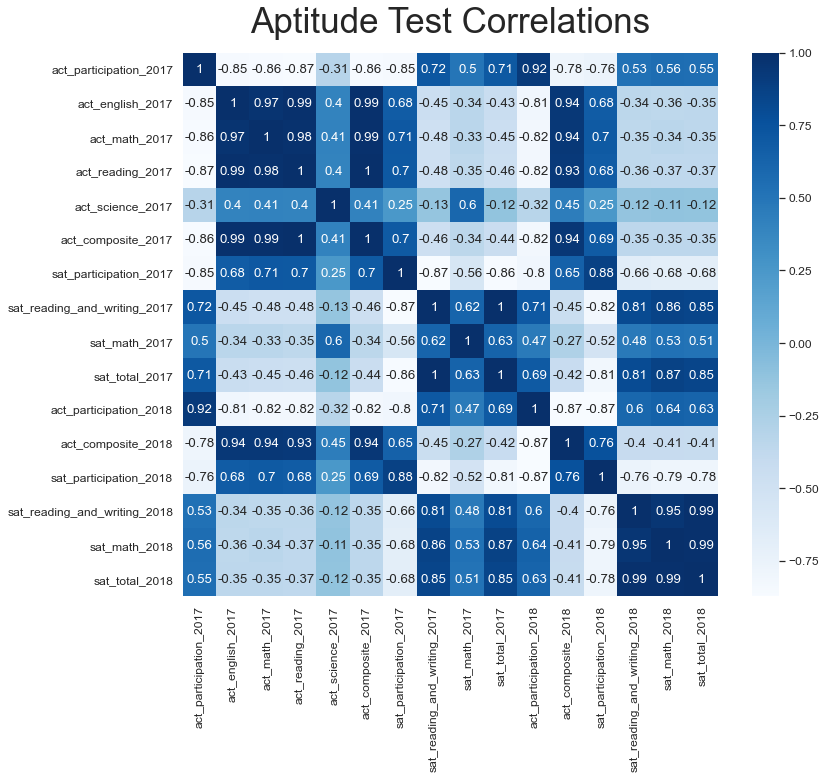
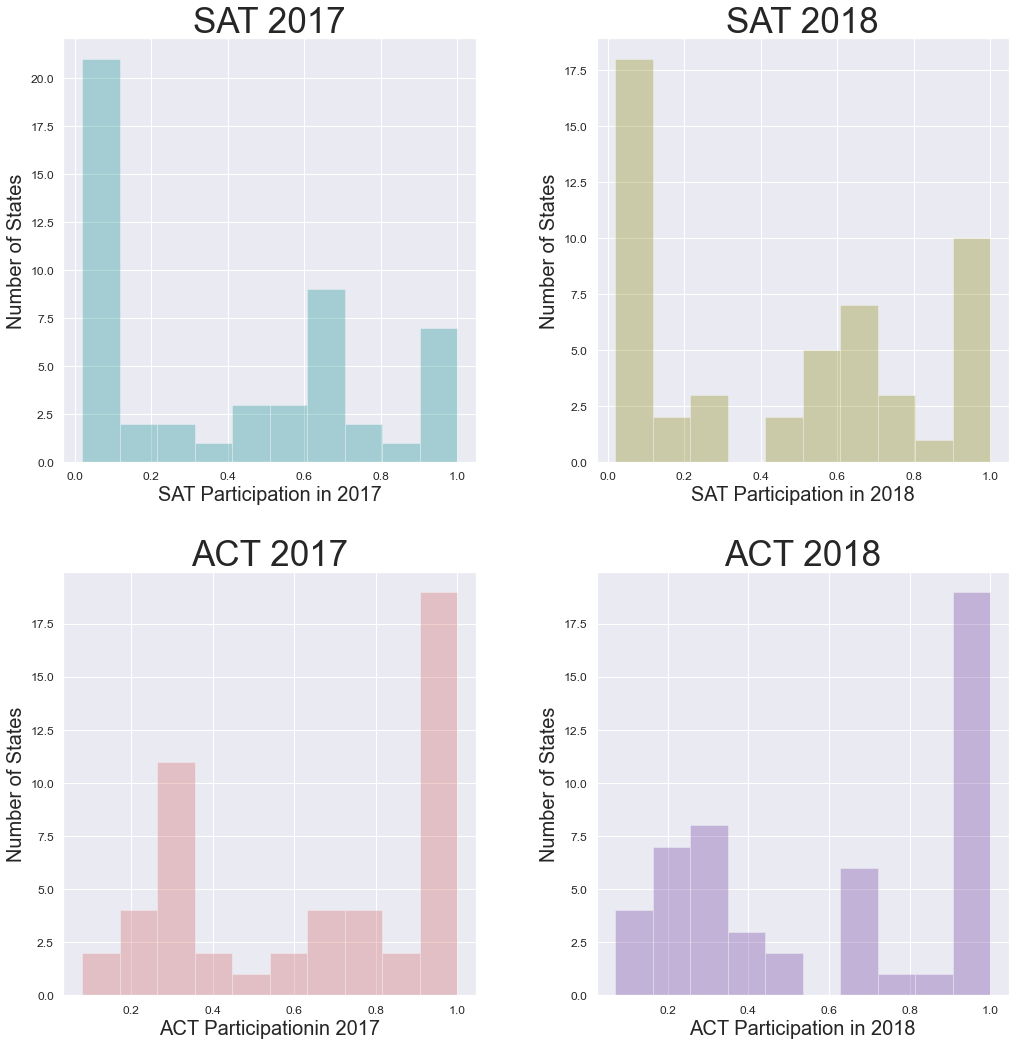
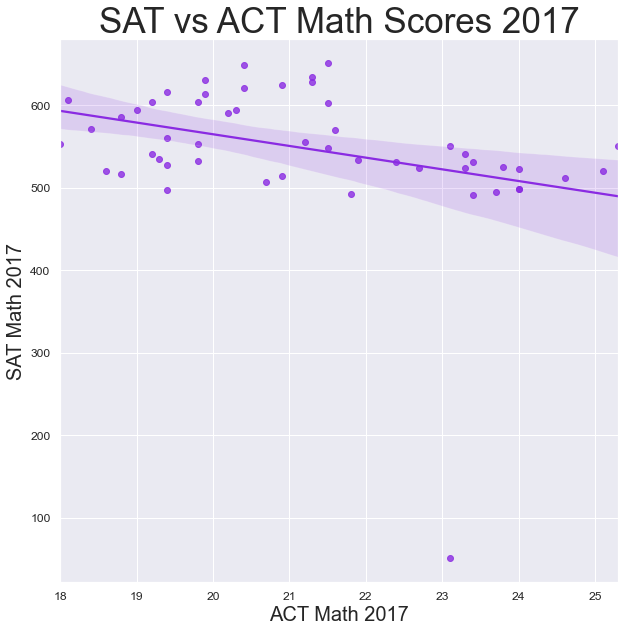
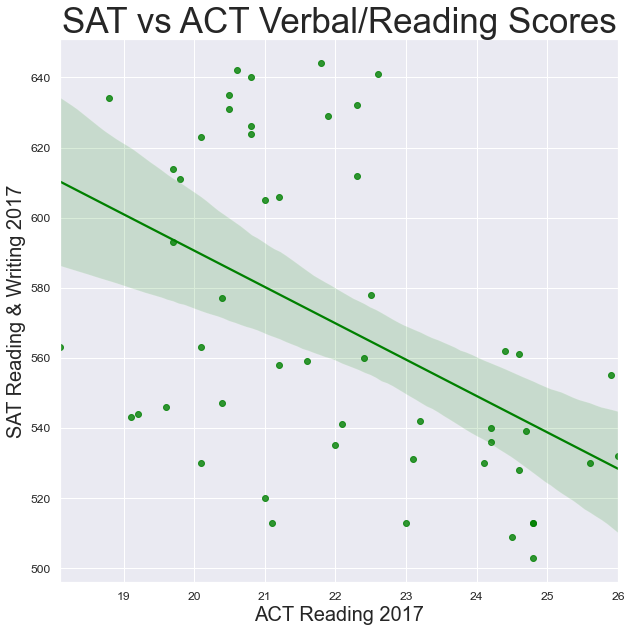
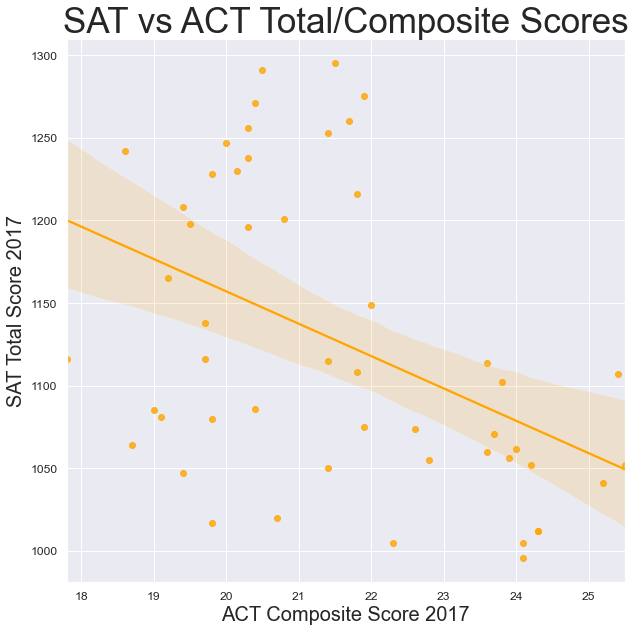
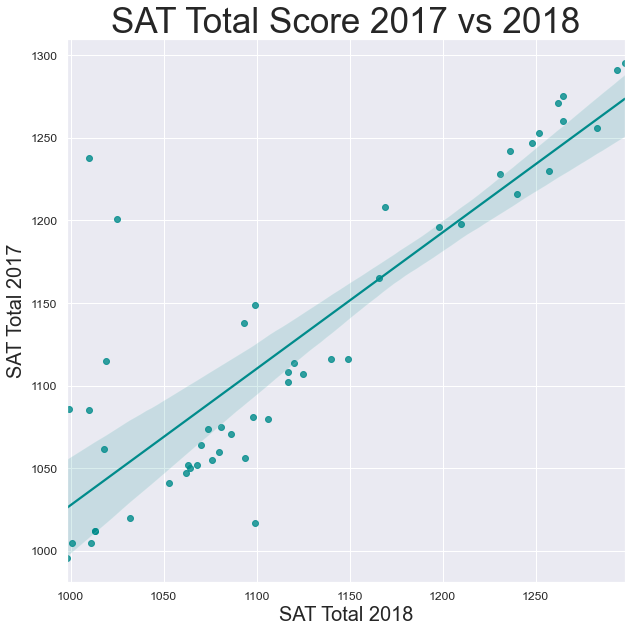
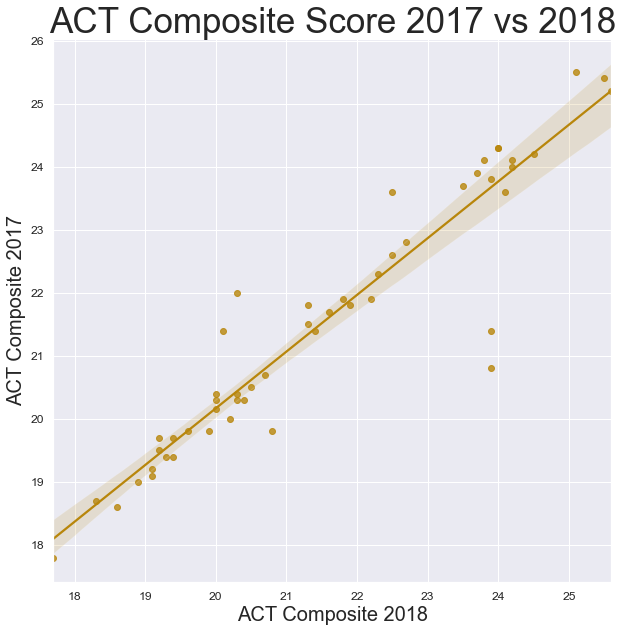
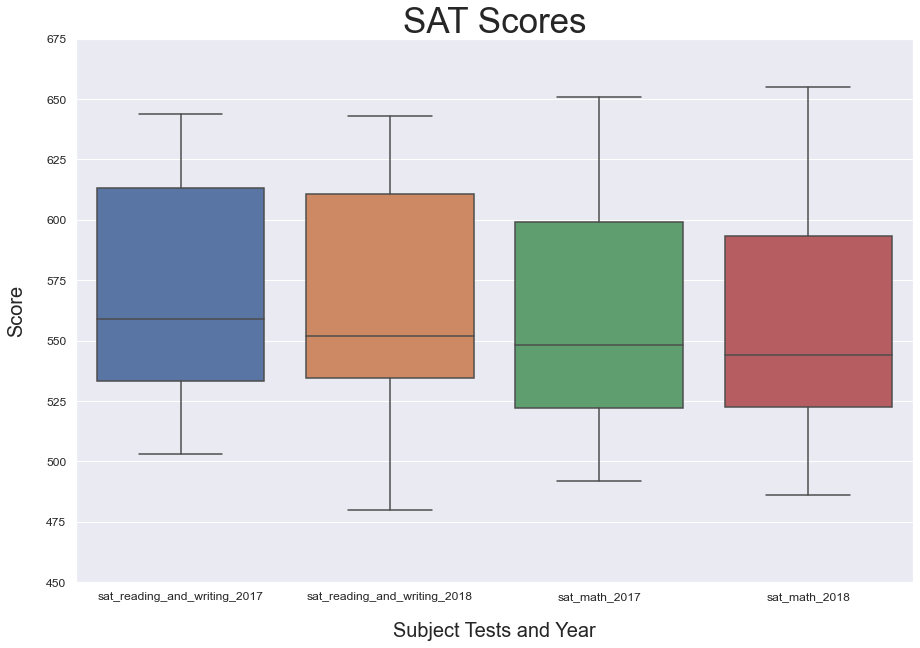
Histograms, box plots, heat maps and scatter plots were used to investigate the data and correlations further.
 |
 |
|---|---|
 |
 |
 |
|
 |
 |
 |
 |
 |
 |
Descriptive and Inferential Statistics
Most of the statistics have a close-to-normal distribution. Although the data points add up to more than 30, more data points would further ensure a closer-to-normal distribution for the numerical variables used in this report.
Outside Research
Research has been undertaken from the official State Education Departments and other related articles. Some of these include the details of state policies with regards to the compulsory taking of the exams and/or the sponsoring of test fees.
Conclusions and Recommendations
State departments of education play a pivotal role in increasing the test participation rates. This can come in the form of state subsidies for the test or making the taking of the test mandatory for all school students. The states of West Virgina, Ohio, Rhode Island and Illinois are examples of such policies which greatly impacted SAT participation rates. The SAT Test Day, which happens on a regular school day also contributed to an increase in the overall SAT participation rate.
Focus on collaboration with state education departments, colleges and high schools would likely lead to the continued increase in SAT participation rates.
More research can be done on university admissions criteria in the U.S, SAT test centers and their usage to helps understand how to further drive participation rates.